How can we help?
Search for answers or browse our knowledge base
Transposition
Principle
Transposition consists of considering that indicators are defined by a crossing of axis and organizing these axis in rows or columns.
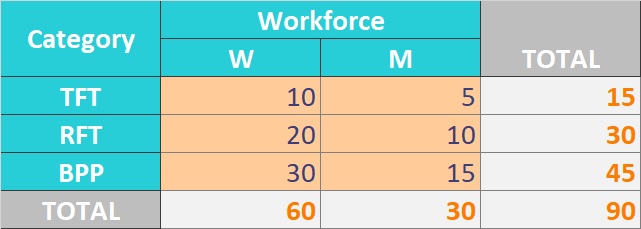
Consider the following document:
Each salmon-colored cell is an input box for counting the number of employees along different axis. In this case, the axis are :
- Category (TFT, RFT or BPP)
- Gender (W or M)
- Workflorce (optional)
How do we want the data to be stored? There are several possibilities:
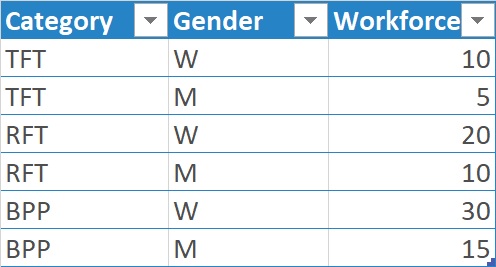
In this case, the “Category” and “Gender” axis would be in rows (there are as many rows as there are elements of these axis), while the Value (Workforce) axis would be in columns (there are as many columns of indicators, 1 in this example).

Here, the “Category” axis is in the row, the “Gender” axis is in the column and carries the indicator, so there is no need for a third axis.

In this case, the “Gender” axis is in row, the “Category” axis is in column and carries the indicator, so there is no need for a third axis.
The transposition consists of distributing the axes into :
- Standard axes whose data will be arranged “in row”. A transposition can contain an unlimited number of standard axis
- Value axis, whose data will be arranged “in column”. A transposition must contain a single value axis.
Creating a transposition
The creation of a transposition is partly done in the QST matrix. The components to be included in the transposition will have to be syntaxed in a particular way. In Design, the axis will be organized and different options specified.
In Excel
The headers of the components to be included in a transposition must contain all the items of the axis at whose intersection they are located, separated by 2 characters “_” in the following way:
ItemAxis1__ItemAxis2[__ItemAxis3]...
In the example above, the headers of the input boxes would be (by choosing the first structure) :
TFT__W__Workforce
TFT__M__Workforce
RFT__W__Workforce
RFT__M_Workforce
BPP__W__Workforce
BPP__M__Workforce
Of course, it is possible to construct all these headers with a single formula. In this example, the formula that would create all the components with their headers would be created in B3 with the following syntax:
="¤¤"&$A3&"__"&B$2&"__Headcount;B;C=I"
…Then copied to all the cells in the “COMPONENT_AREA” using a copy/paste formula. Note the use of the C=I flag to ensure that an integer number is entered.
In Design
Checking the structure
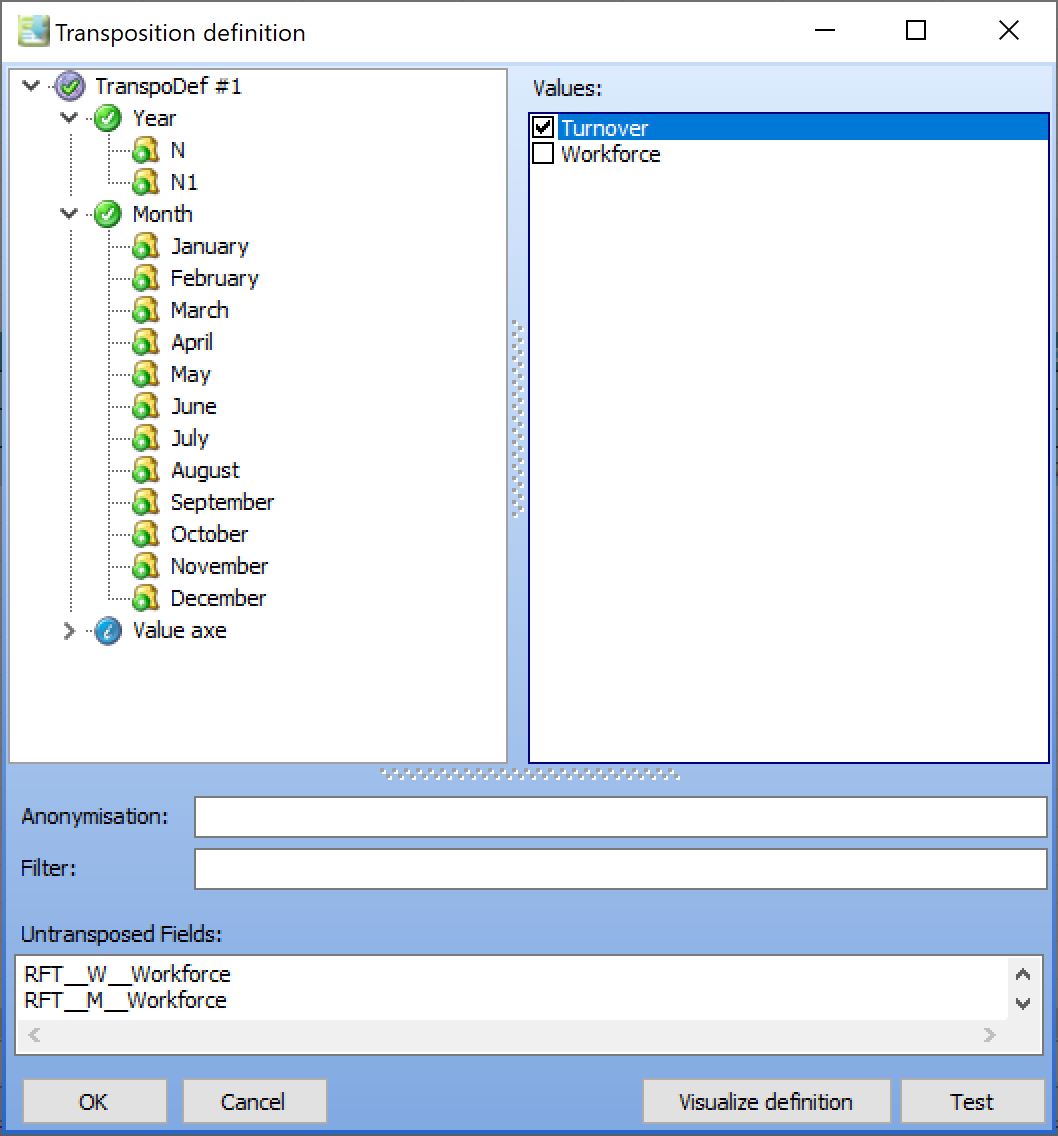
Once the table has been imported into Design, go to the “Questionnaire” menu and select the “Transposition Definitions” item; then, in the list of transpositions that appears, click on the “Add” button. You will obtain the list of axis which, once all the axis have been unrolled, will be displayed as follows:
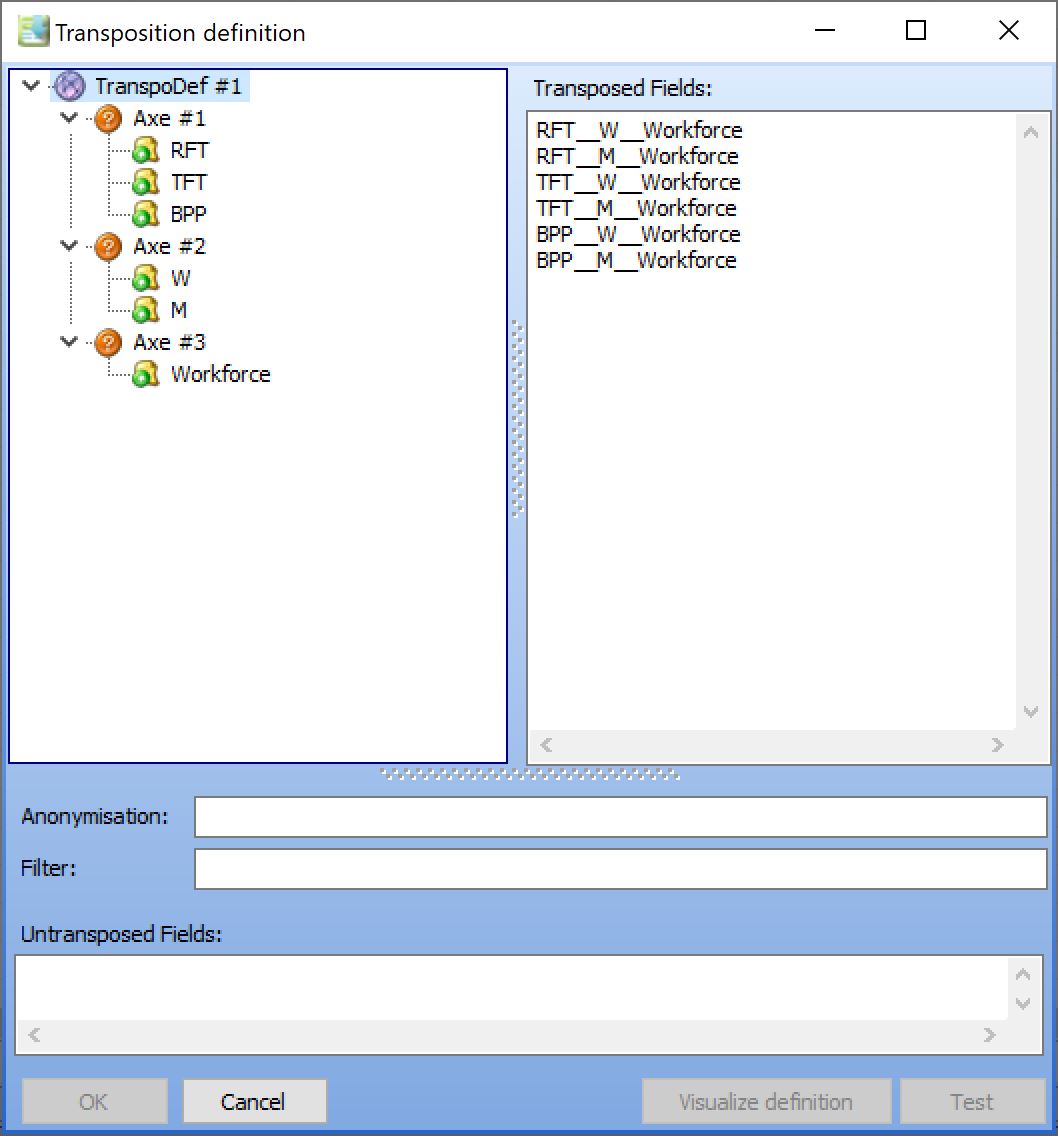
As a GT document can contain several transposition definitions, they will appear in this window under the name TranspoDef n°1, TranspoDef n°2, etc. In our case, only one definition is present. By selecting the definition “TranspoDef n°1”, the panel on the right displays the list of headers included in this definition.
On the left, the transposition definition is displayed like a tree showing the axis and their items. The axis have a circular orange icon with a question mark at this stage because the axis have not yet been qualified as standard axis and value axis.
Checks :
- If you get more than one transposition definition at this stage, you have probably made an error when replicating the formula defining the input boxes.
- If, on the other hand, you do not get any transposition definition, it is probably because you have separated the axis items by only one underscore character (“_”): the axis items of a transposition must always be separated by 2 underscore characters: “__”.
Definition of axis
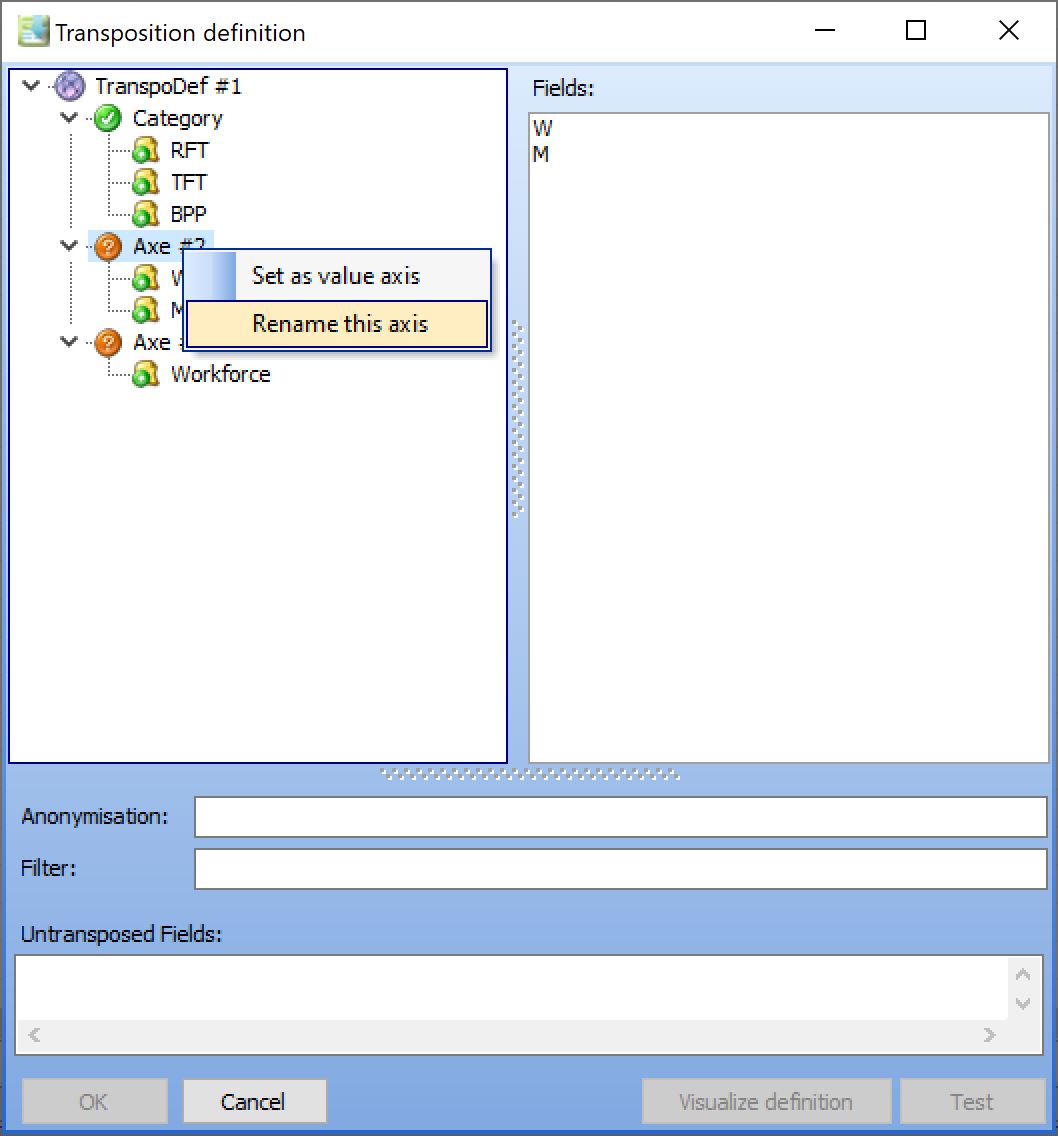
We will rename the first two axis to “Category” and “Gender”. To rename the axis, right-click on an axis and select “Rename this axis” in the pop-up menu”. You can also select the axis to be renamed with the mouse and press the F2 key on your keyboard.
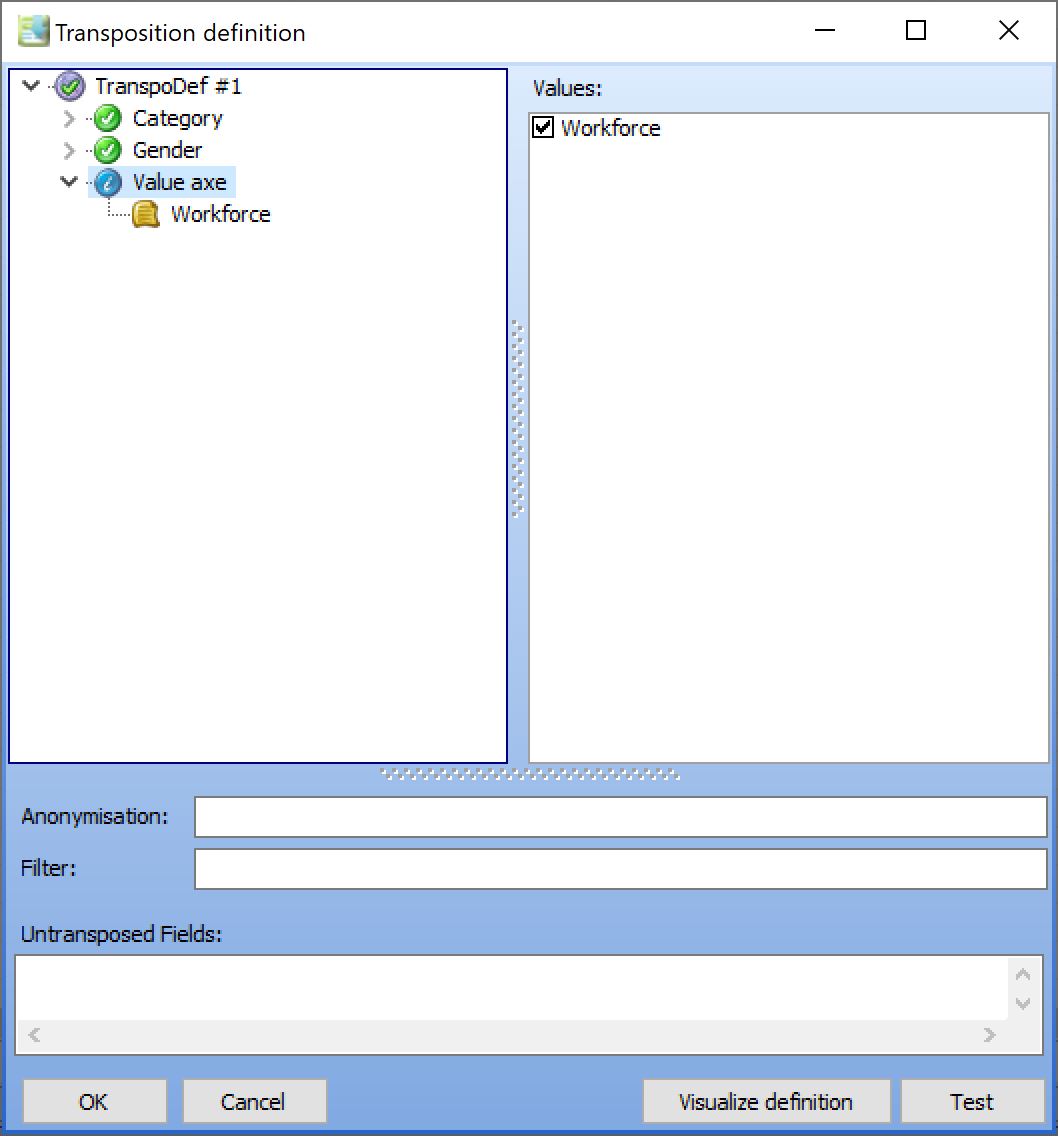
The last axis, which contains only the ” Headcount ” item, will serve as the value axis.
To specify it, simply right-click on this axis and then select the item “Select as value axis” in the pop-up menu”.
Ensure that the only item of the value axis: “Headcount”, is checked in the panel on the right.
Test the resulting structure
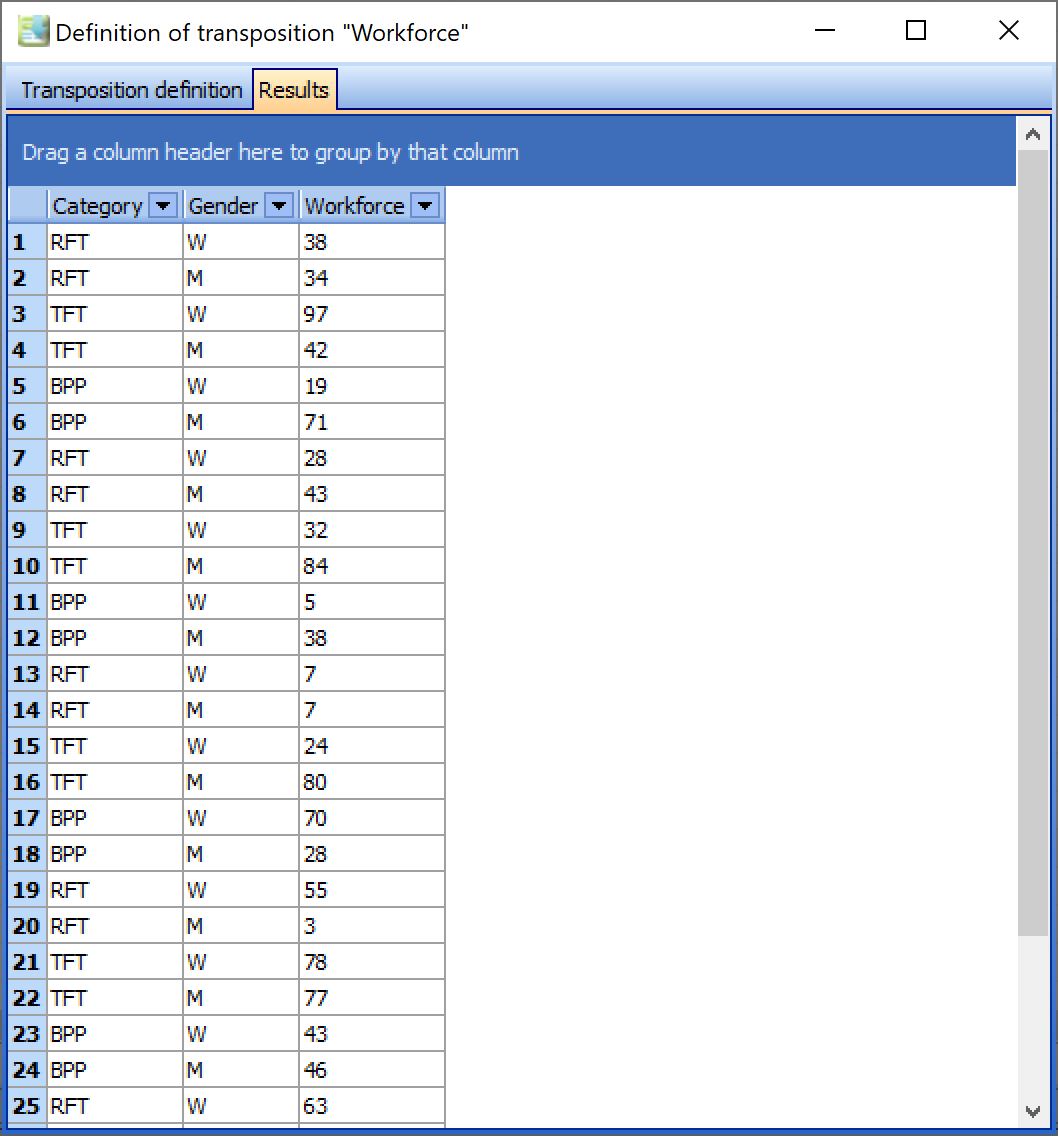
Click on the “Test” button. A new tab appears, showing you the structure of the transposed data using random numbers. Note that if the components providing the data to be transposed did not carry a numerical constraint (text field, or without explicit type as for the control components), the preview would display “Dummy” for the corresponding values.
To exit the preview, you must click on the “Transposition Definition” sheet. If you close this window, any changes you have made to your transposition definition will be lost.
Once back on the transposition definition sheet, modify your definition or click the “Ok” button to save it.
Managing transpositions with the same number of dimensions/axes
When you add a transposition definition to your form, Design will automatically detect all headings that may be part of a transposition and group them according to the number of axis. This may not match the data structure you wish to implement. If two tables use the same number of dimensions/axis, the desired transpositions for each table may be different.
Consider the following example:
These two tables correspond to completely different data from a professional point of view. However, they have the same number of transposition axis. Let’s see how to manage this:
- Type the following formula in cell C4:
="¤¤"&$B4&"__"&C$3&"__"&$C$2&";B;C=I"
- Copy/paste this formula to the “HEADCOUNT_COMPONENTS_AREA”
- Type the following formula in cell C11:
="¤¤"&$P11&"__"&C$10&"__Turnover;B;C=R"
- Note that for the formula to work, the developper had entered the value “N” in P11 and “N1” in P12
- Note how the syntax of the objects as well as some labels are discarded outside the import area so that all components of this table can be created with a single formula.
- Copy/paste this formula to the “CA_COMPONENTS_AREA”
- Import the area “IMPORT_AREA” into a new form
- Add a transposition definition
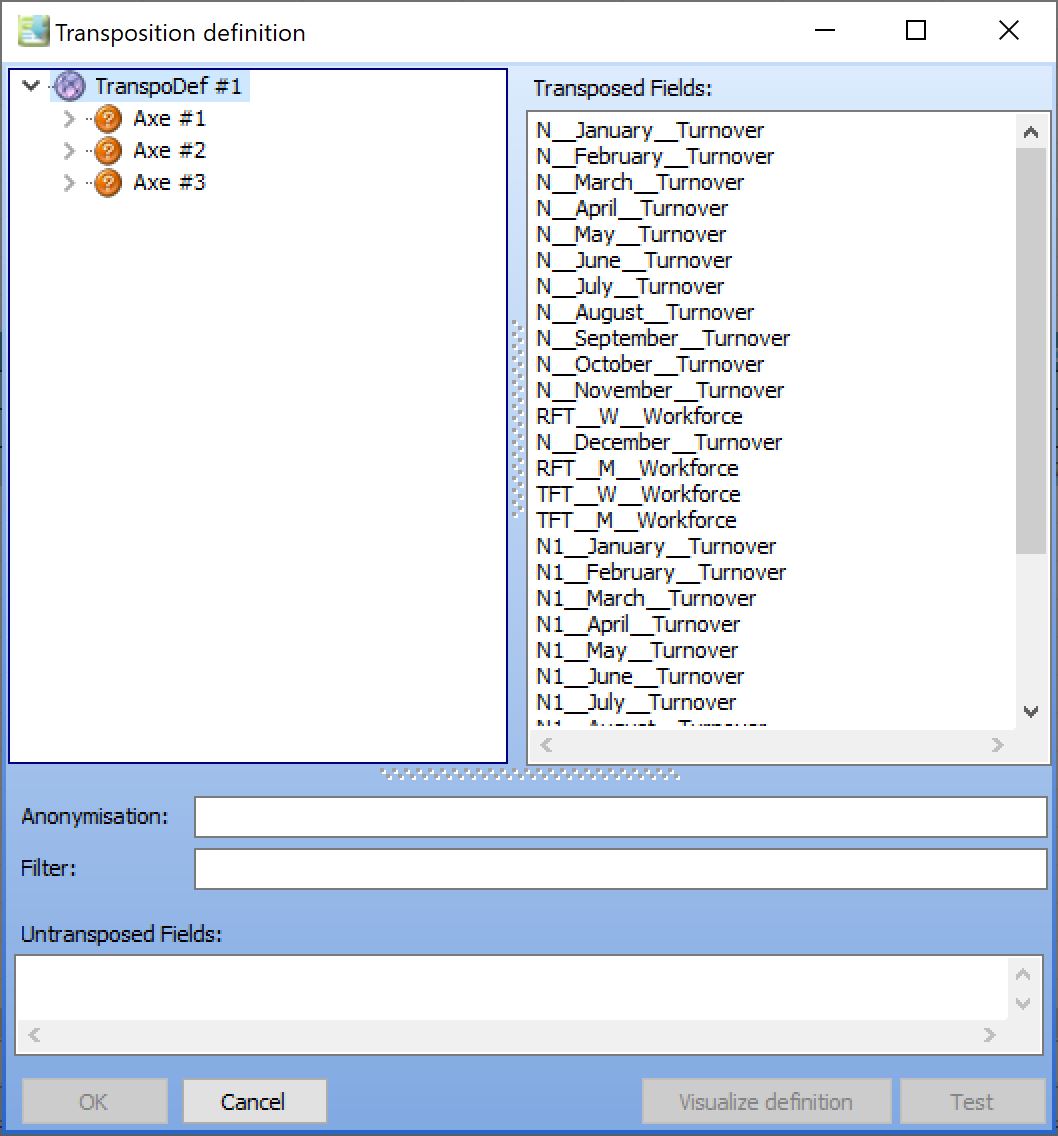
Design only detects one transposition definition because all headers in the questionnaire have the same number of axis (3 in our case). This poses a problem if we wish to integrate the collected data into 2 separate storage tables and/or feed these tables with 2 separate tables/views.
Two methods can be used to achieve the result: a differential selection of the value axis or a filter on a discriminating axis.
Selection of value axis items
- From the blank form into which you imported the Excel selection, add a new transposition definition.
- Start by defining the third axis as a value axis
- In the panel on the right, uncheck the “Headcount” indicator, only “CA” should be checked.
- Once “Headcount” is unchecked, all other axis contain only items related to the CA table.
- Save your transposition definition
- Create a new transposition definition in which, in contrast, you select only the “Headcount” indicator.
Note: this method works in the example described because for both tables, the indicator is the third axis. Be careful about the order of the axis if you plan to use this filtering method.
Standard axis filter
The ability to keep only a part of the items is reserved for the value axis. However, it is possible to filter a transposition against a standard axis. In our case, we will add a new axis containing the name of the table, and we will filter on this axis. To do this, proceed as follows:
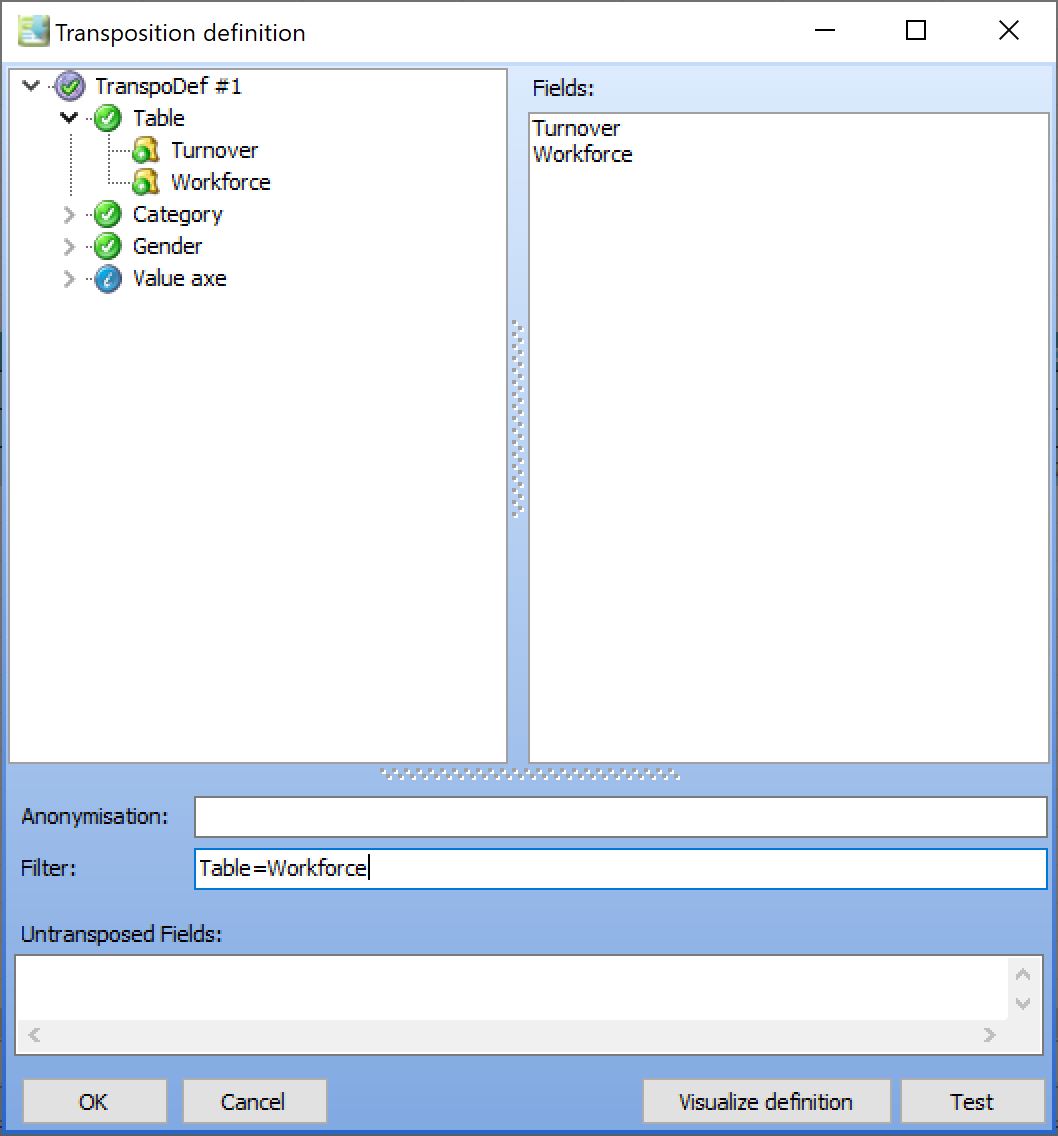
- Change the formula in C4 to this one: =”¤¤Workforce__”&$B4&”__”&C$3&”__”&$C$2&”;B;C=I”
- Change the formula in C11 to this one: =”¤¤Turnover__”&$P11&”__”&C$10&”__Turnover;B;C=R”
- Replicate the formulas on the respective component areas
- Import the modified workbook into a new form
- In the “Filter” field, type the following filter Table=Headcount_Table
- Save your transposition definition and then perform the same operation with the following filter:
Table=Workforce
- Note: unlike the value axis filter, the filter does not act at the design stage: if you unroll the axis of the transposition, the items of both tables will appear. Preview to check the effect of the filter.
- Note 2: Filters can be combined in the form (Axis1<>Item1 AND Axis2=Item2) OR … If items contain spaces or other non-alphanumeric characters, protect them with single quotes. If the axis contain spaces or other non-alphanumeric characters, protect them with square brackets.
- Note 3: The “Filter” field can also be used to select/filter items on the value axis by using the syntax {} to designate the value axis. For example, {}= Headcount will only retain the item ” Headcount ” in the value axis
Anonymisation of dates
Principle
Documents are very often “rolling”: they are transmitted at regular intervals and typically compare the value of one period with that of the previous period. The purpose of the date anonymisation function is to reflect a date shift in relation to a reference date (which will generally be the statement date of the campaign).
The date anonymisation will specify the periods with the following syntax:
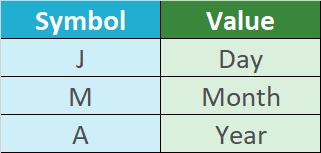
The offset from the statement date will be specified as follows:
[mp_+-]number
- Note: it is not recommended to use the operators “+” and “-“, since headers containing these characters are incompatible with the Excel Names used to create an input matrix, preferably use “m”, “p” and “_”.
- Note 2: the offset can be absolute or relative
- Note 3: from version 3.7 onwards, null/empty dates or dates that cannot be interpreted by the transposition (e.g. empty or 35/05/99) raise a warning. In the case of null dates, the warning can be avoided by converting the empty/ null dates in a DBMS view to a date that does not interfere with the data (e.g. 01/01/1970).
Examples:
- M-12 to specify a date 12 months back from the statement date. (M_12 and Mm12 are equivalent)
- A-1 to specify a year backwards from the statement date. (A_1 and Am1 are equivalent)
- M12A_1 to specify the month of December of the previous year in relation to the statement date (M12A-1 and M12Am1 are equivalent)
- M1Ap1 to specify the month of January of the year in relation to the statement date (M1A+1 is equivalent)
Example 1
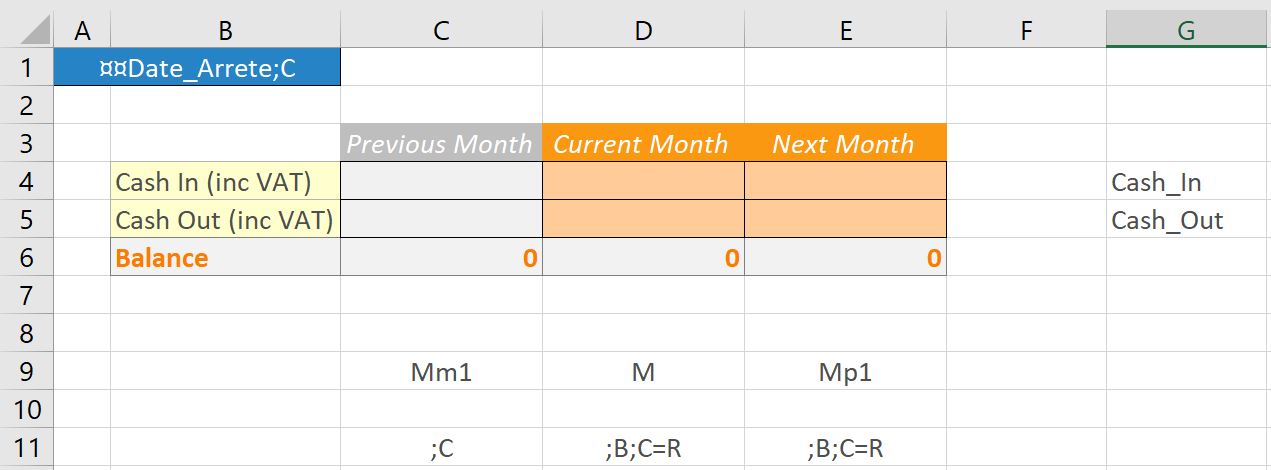
Consider the following Excel file:
This form is supposed to allow the input of indicators for the current and next month and compare them to the previous month of the current month. To allow the form to be refreshed from one month to the next and to store the data without having to “manually” construct the date of each value, we will proceed as follows:
- The statement date is specified in A1. “Date_Arrete” is a system variable provided by GTServer.
- Row 9 contains the month offsets: Mm1, M, Mp1… These offsets are relative to the statement date
- Column G contains the indicator labels
- Row 11 contains the types and switches of the components to be created
- In C4, type in the formula to create all the objects in the table:
="¤¤"&$G4&"__"&C$9&C11
- Duplicate this formula fromC4 to E5
- Import into a new document
- Create a new transposition definition with the following parameters:
- Axis 1: Define this axis as Value Axis
- Axis 2: Rename this axis to “Period”
- In the “Anonymisation” field, type the following syntax:
Month/statement_Date
- Test your transposition:
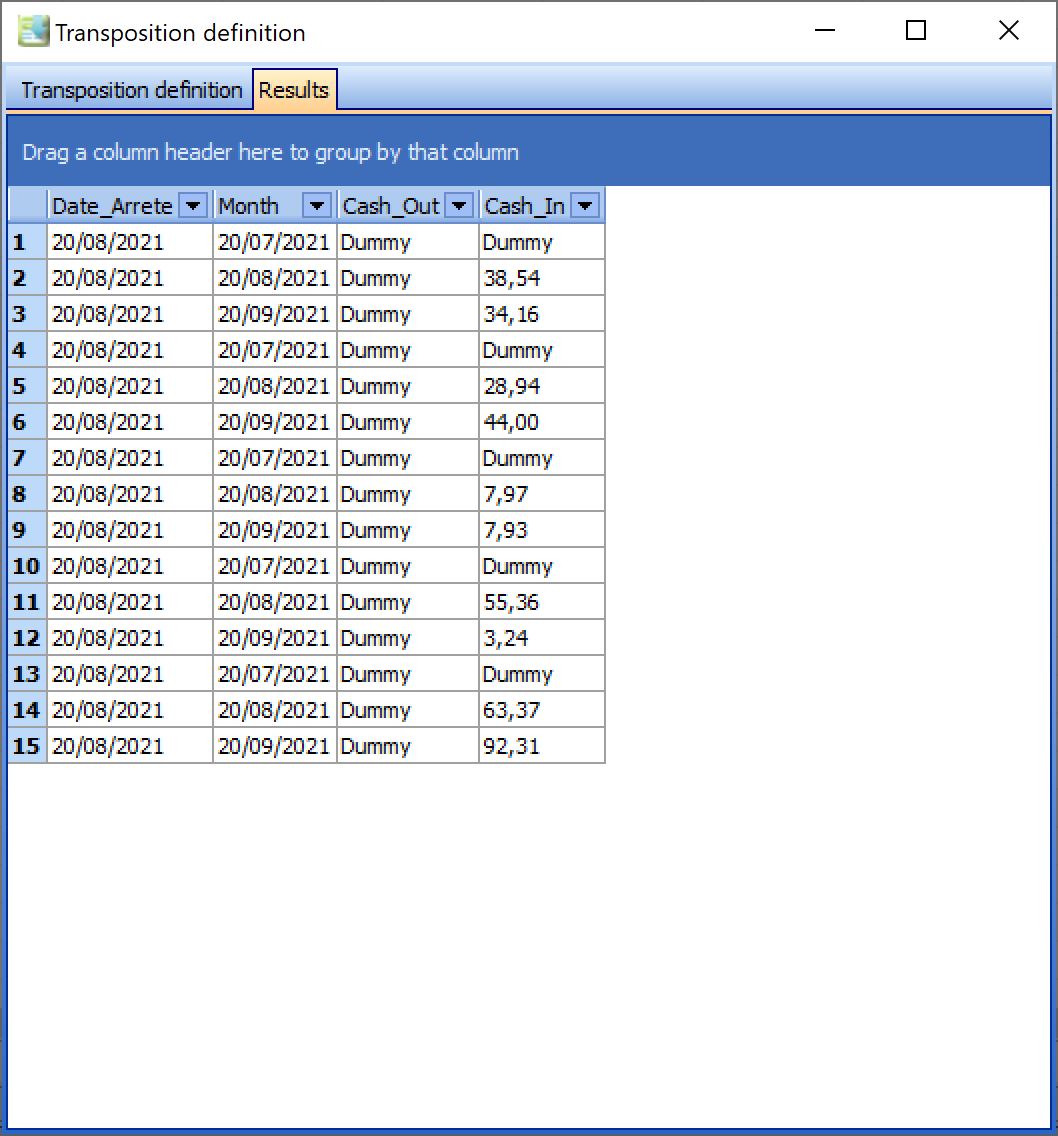
Notice the effect of the anonymisation: the “Period” field which contained the items “M”, “Mp1”, “Mm1″… Now contains the resolved dates.
Note: Dates are always displayed in DD/MM/YYYY format
Note 2: During a preview, the statement date is always set to the system date.
Note 3: the “Dummy” value is displayed for values for with the system is unabled to determine a type. Here it stands for the values coming from a Control component, as controls have no type.
Example 2
Consider the following Excel file:

For a given year, this form is supposed to allow the input of indicators for all months of the current year and compare them to December of the previous year. To allow the form to be refreshed from one year to the next and to store the data without having to “manually” construct the date of each value, we will proceed as follows:
- The statement date is specified in A1. “Statement_Date” is a system variable provided by GTServer.
- Row 8 contains the offsets for the year: A_1 or A. These offsets are relative to the statement date
- Row 9 contains the month offsets: M12, M1, M2… These shifts are absolute in relation to the statement date
- Column Q contains the indicator labels
- Row 11 contains the types and switches of the components to be created
- In C4, type the formula to create all the objects in the table:
="¤¤"&$Q4&"__"&C$8&C$9&C11
- Duplicate this formula from C4 to O5
- Import the into a new document
- Create a new transposition definition with the following parameters:
- Axis 1: Define this axis as Value Axis
- Axis 2: Rename this axis to “Period”
- In the “Anonymisation” field, type the following syntax:
Period/Date_Arrete
- Test your transposition:
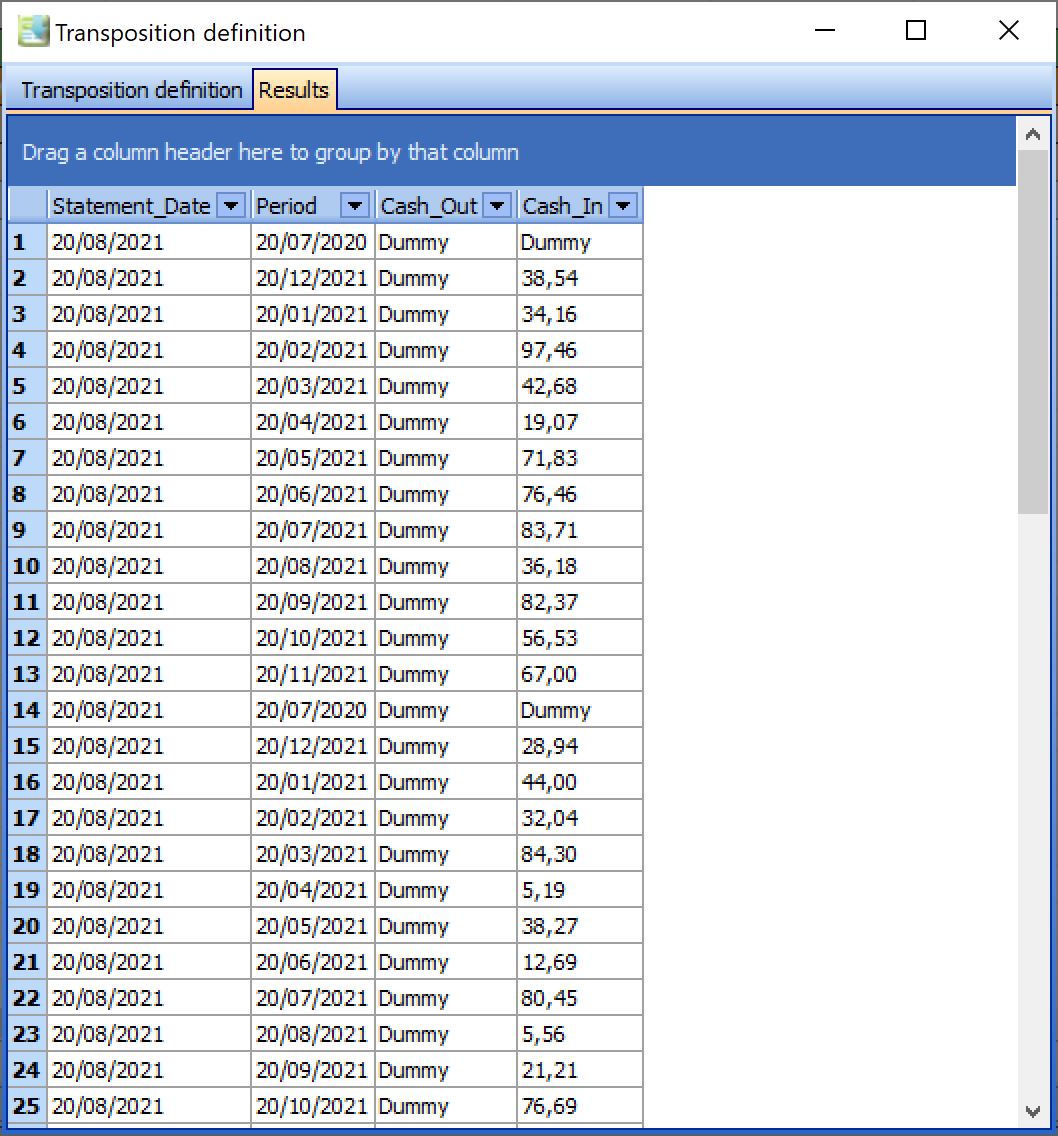
Note the effect of anonymisation: the “Period” field which contained the items “A_1M12”, “AM1”, “AM2″… Now contains the resolved dates.
Note: Dates are always displayed in DD/MM/YYYY format
Note 2: During a preview, the statement date is always set to the system date.
Note 3: the “Dummy” value is displayed for values for with the system is unabled to determine a type. Here it stands for the values coming from a Control component, as controls have no type.


